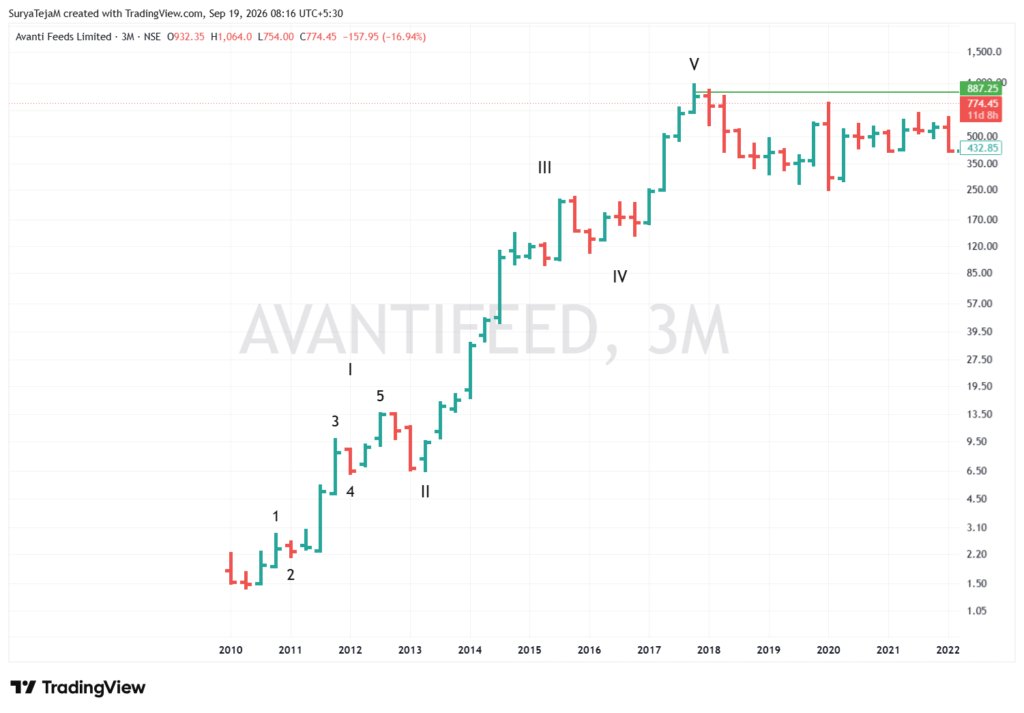
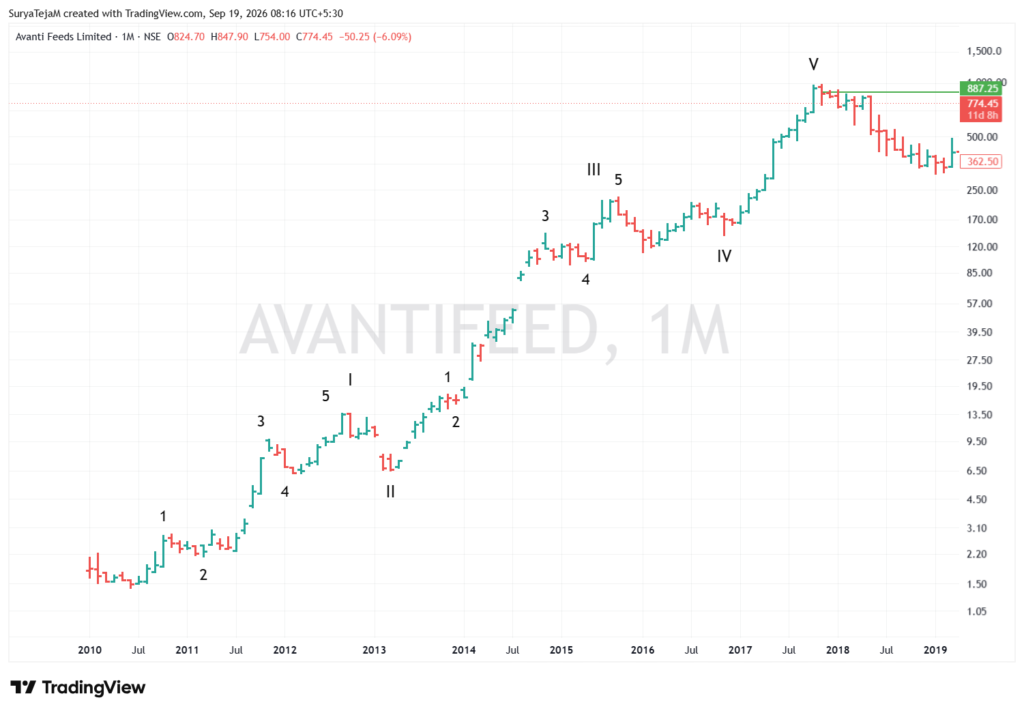
The below are the charts of Avantifeed of 3 month and 1 month time frame respetively. The stock has made a 5 wave impulse in both the 3m and 1 month Tf from the lows of 2010 to 2017. After which i went for a long consolidation of nearly a decade before breaking.
Consolidation part :
Avantifeed started its consolidation in 2017 and the stock looks like it completed its correction in march 2023 and started its new leg up and what followed was a 5 wave move up from March 2023 to March 2026. Now it looks like its correcting. The support levels are 711 and 550-590 levels downside.
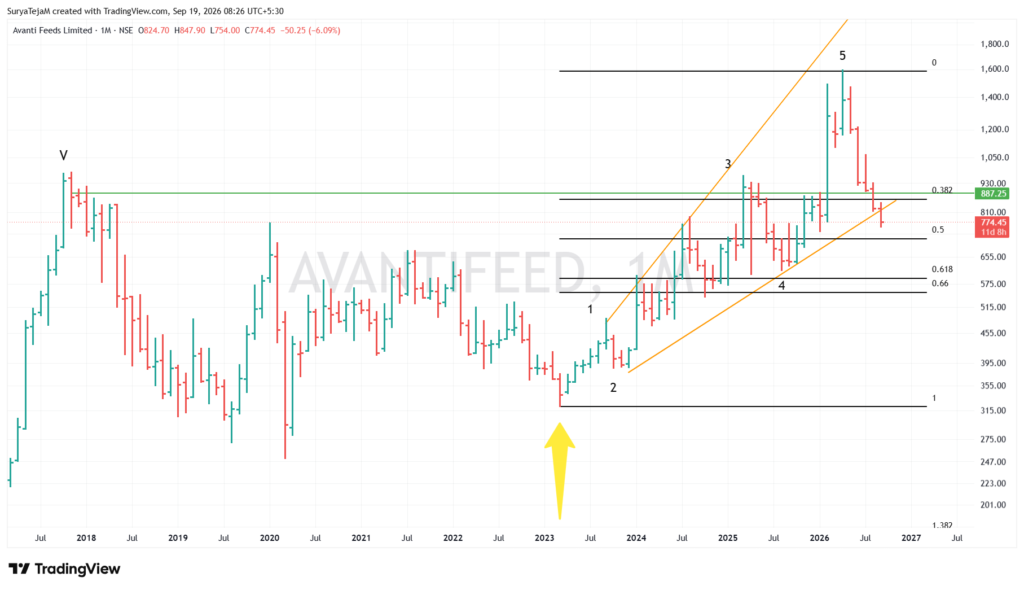
Failure in holding these levels may see futher downside and brings an intresting observation and an alternative view.
The enter move from low of 2020 to high of 2026 april can be taken as A-B-C correcting (B) wave as it is under 1.382 retracement level. and the next wave going to happen is a big and fast move downside in (C) wave which may break 250 levels also. the stock is curently trading at 774.
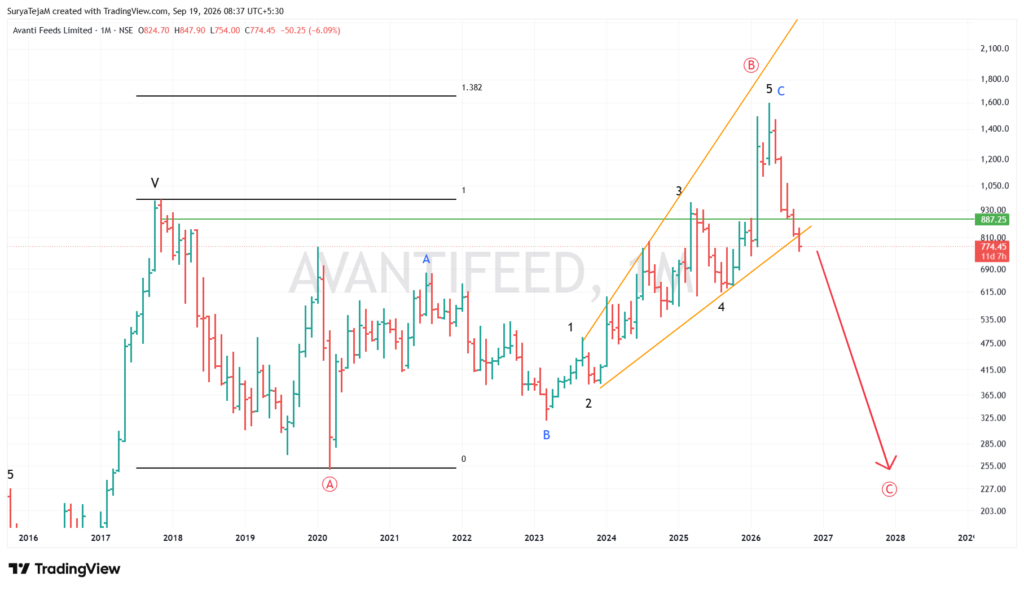
If The alternative view of Extended Flat comes to be true. The Next Big upmove starts only after a fall in C