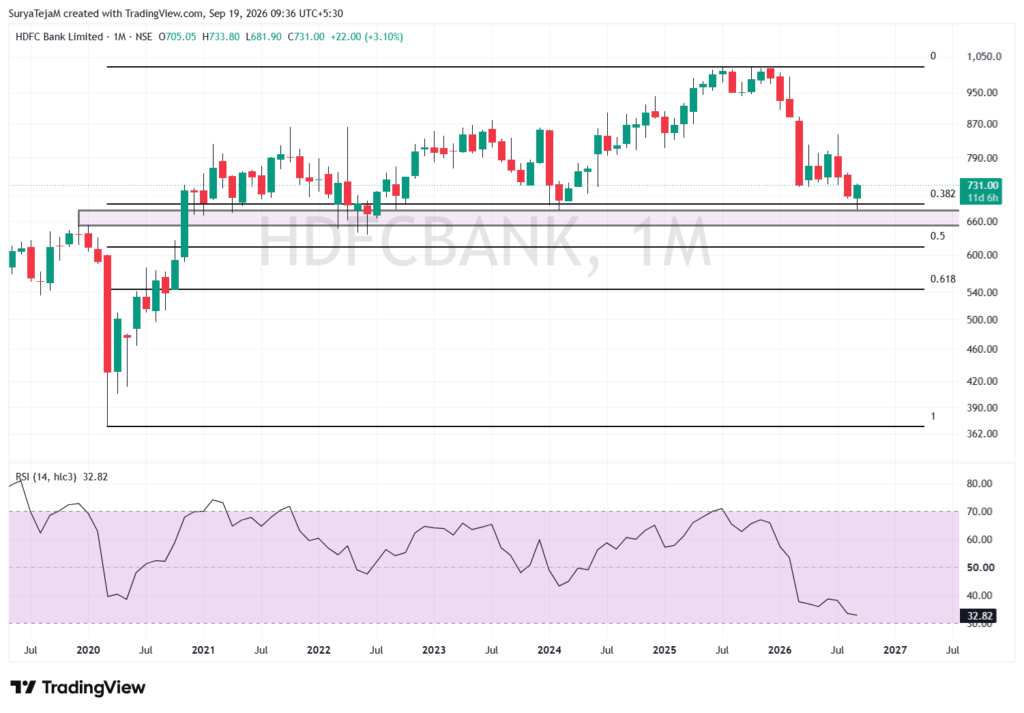
Hdfc bank is in correcting phase from december 2025 and now has reached an important support of 38.2% Retracement and about to close positive for the month.
Monthly chart
It has a support band of 650-680 levels. The Rsi indicator has reached an monthly oversold reading below 33 which is lowest ever for the stock
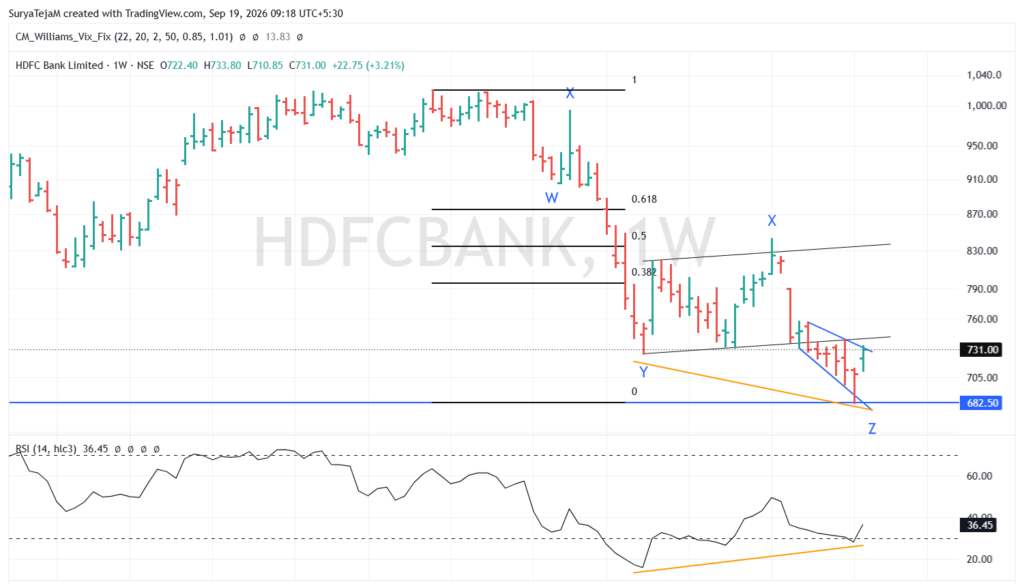
On Weekly Chart
There is a positive divergence with RSI. The New low in price is not confirmed by rsi.
Wave count and with poitive weekly close this week, it appears to be completing W-X-Y-X-Z pattern. HDFC Bank now have the good probability for a retracement of 50% – 60% or even a new All time high.
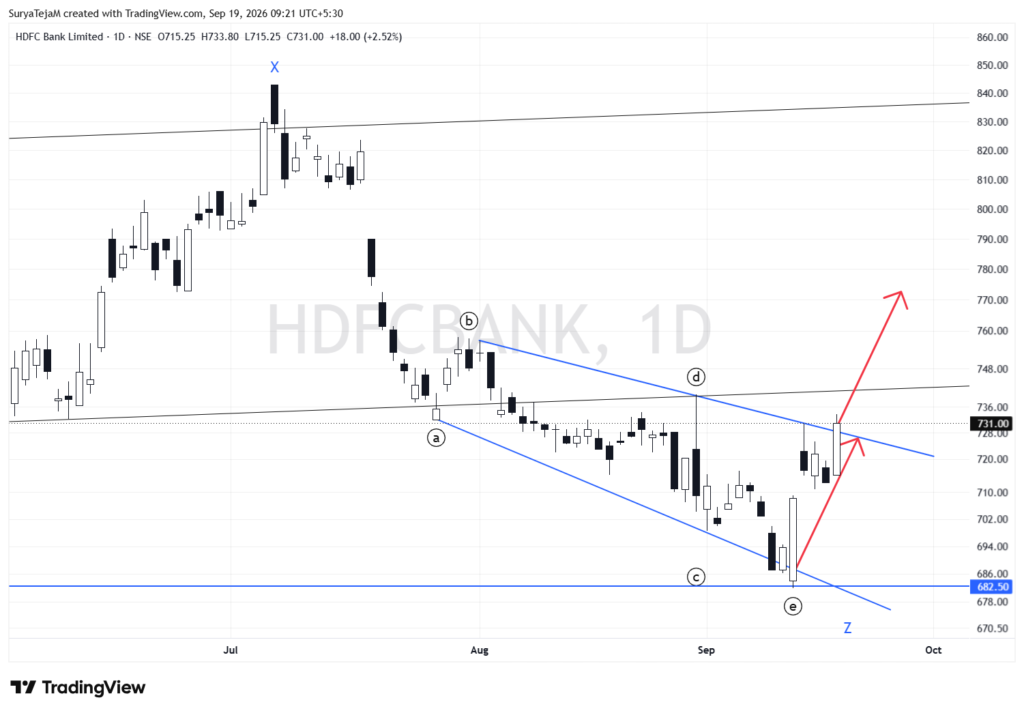
On Daily charts
We have a Broadening wedge type of a structure (doesnt looks perfect one though). on Friday price broke out of the pattern and attempting to go higher. A continuation in higher prices can lead to 780 levels and to higher prices of 850 later on which is previous swing high